This is joint post by Jawwad Farid & Faizan Siddiqi *
Before we start let us all take a deep breath and try to ascertain what GMV means.
Gross Merchandise Volume
From Wikipedia
Gross merchandise volume or GMV is a term used in online retailing to indicate a total sales dollar value for merchandise sold through a particular marketplace over a certain time frame. Site revenue comes from fees and is different from the dollar value of items sold.
GMV or gross merchandise value for e-commerce retail companies means sale price charged to the customer multiplied by the number of items sold. For example, if a company sells 10 books at $100, the GMV is $1,000. This is also considered as “gross revenue”. In this case, the business model is based on a retail model, where the company basically purchases the items, maintains inventory (if need be) and finally, sells or delivers the items to customers. It does not tell the net sales or actual amount of audited services as GMV does not include discounts, costs involved and returns of products.
GMV Estimation
- In order to estimate GMV we could use three possible methodologies.A top down approach that starts off with a single piece of data from an authentic and well respected source and builds up an educated estimate on top of it
- A bottom up approach that tries to piece together the market size based on what we know of local market participants. We pick the top 20 players, add up the sum of their GMV, scale it up by a factor of 30% to 40% and voila we have estimate number .
- A forward looking approach that ignores current data looks ahead 5 years to see where our market is likely to be and work backwards from that figure for estimate number 3.
With all three approaches the objective is to keep the assumptions (moving parts) to a minimum and base the model on at least one authentic, publicly reliable data point.
In the absence of transparent market based disclosures, the true answer will likely be found somewhere in between using some exotic mix of all three approaches.
To illustrate the mechanics for purely illustrative and educational purposes we will use one approach to make a simple point. Any analysis we do at this point is going to be completely irrelevant a year down the road. Perhaps even sooner, but to have a conversation and to understand the real potential of the scale of what is to come.
Given the direction this market is going and given how this specific movie has played in other developing markets before us, the current market size or efforts to estimate it are useful for educational purposes only. You can’t put them to work or use them for deal making, acquisitions or valuations given the disparity you are likely to run into when it comes to projecting the next 5 years. Nothing is constant over 5 years let alone what we are about to project out. It can no less be a basis for getting in on the action.
Model One. SBP data set
Let’s begin with a look at the most basic of our collection of known documented facts. The source for all three statements below is the State Bank of Pakistan Annual review report of 2017.
- E-Commerce in Pakistan has 571 merchants offering their products online. During FY 17, 1.2 million transactions valuing PKR 9.4 Billion were processed through ecommerce[1]. Using the current exchange rate of 105.25 that translates roughly into USD 89 million – the share of the local ecommerce pie captured by credit and debit cards.
- There are 17.9 million debit cards and 1.2 million credits cards issued by the banking system.
- The 9.4 billion and 1.2 million transactions suggest an average ticket size of USD 74 per transaction.
Remember that these are all unadjusted figures. We can use them as is but its best to account for and adjust some items that may impact local market size estimates.
The likely case
We take the USD 89 million figure and trim it to account for local ad spend on Google/Facebook platforms. This trimmed figure then get scaled up since a large chunk of local e-commerce pie uses cash on delivery or COD. We put in a range of values for the distribution between COD and cards and generate our final total market size estimate.
There are two key variables.
- The adjusted figure that represents the share of credit cards in local ecommerce sales. We can round this up to total ecommerce sales using the second variable below.
- The share of COD in local ecommerce sales. If we know the dollar amount of card sales, we can use the COD component to scale up total sales.
We can plug in a range of values for both parameters and see the possible range for total market size. When we do this we end up with the grid below.
Here is how you read the grid. There are two bands that represent the two parameters. The row on top (US$) and the column on left (%) that we use for navigating to the estimated value.
The row on top gives the trimmed down estimated figure that represents the share of credit cards in total ecommerce sales. It ranges between values of US$ 30 to US$ 80 million. The column on left gives the percentage share of COD in total ecommerce sales. It ranges between 25% – 95%
The table below has 5 distinct colored bands. The one that we are interested is the light green 3×3 matrix with bold figures that represents values on which consensus can be built. Primarily because these are values that we see across vendors we track and talk to. Anything outside the grid is certainly possible but is not supported by credible, authentic, publicly available data points. If you have data that contradicts these points and are willing to share it, we will be happy to update this analysis.

The range in this specific grid is between US$ 100 to US$ 500 million per year. The likely answer for estimated GMV is somewhere between US$ 333 million to US$ 500 million based on this model.
Which implies that our trimmed down estimate for credit card share is somewhere between US$ 50 – US$ 70 million and our estimated COD share of total sales is between 85% – 90%. Market feedback suggests that the COD share could be as high as 95% but we are happy with our 90% estimate.
Now that we have these two values, we can dig a bit more and see if we can find additional data points that would support or challenge these assumptions.
There are also two new questions that we need to answer. Both deal with growth.
- At what rate is the ecommerce market growing?
- If it keeps growing at this rate for another five years what would be the total market size? Would it be large enough to be of interest to serious money?
These questions are of interest because they allow us to tackle the same problem from another angle. Where will things be 5 years down the road? From that specific perspective how attractive or unattractive does the current market or market valuations look right now?
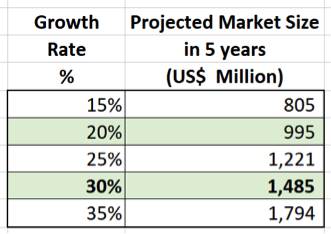
This is the question we should really be asking ourselves. How big will the total pie be in 5 years? Using the midpoint of US$ 400 million from above and a 30% annual growth rate for the next 5 years we end up a rough estimate US$ 1.5 billion.
That is the limit of our current analytical tools. We are bound and married to data in the visible spectrum. When we stretch the visible spectrum our numbers become questionable.
Time to throw this analysis and this model out of the window for one simple reason.
We used a similar logical rational step by step model to estimate the projected future share of smart phones in the local market in 2009-2010. The objective was to project actual smart phone in use in Pakistan in 2015. Two of our smartest analysts and a data czar took part in the exercise. With hindsight our estimate was off by about 97%. It was good thing our analysis was not released for public consumption.
Model Two – The alternate forward looking perspective
When compared to our nominal GDP basis the figure of US$ 1.5 billion is not exciting. It looks great compared to your current size but it is actually quite depressing and unlikely for reasons that we will just highlight.
One hint is the metric that measures the size of the internet economy as percentage of total GDP. The G-20 benchmark[2] for this metric is 5.5% with some economies seeing values as high as 12%. Given the availability of 4G data, the affordability of smart phones, the increasing share of data enabled phones in local phone sale and the growth of online retailers in the local economy, our benchmark figure is likely to rise.
Before you flag or question the G-20 metric let’s take a look at G-20 membership. In addition to the developed world, the G-20 also includes the following countries – India, Indonesia, Argentina, South Africa, Saudi Arabia and Turkey. We are not just talking about North America or Western Europe, some of these markets are quite similar to our own in terms of cell phone penetration, population demographics, data usage and middle class growth trajectories.
Now back to the GDP. Our estimated GDP figure on a nominal basis for 2017 is US$ 304 billion. 5 year later in 2022 this figure will hit US$ 380- US$ 400 billion using the current growth rate of 5%.
US$ 1.5 billion in ecommerce sales represents less than 0.4% of our current nominal GDP. The G-20 benchmark by 2022 is estimated to be between 7% – 12%.
Our actual number 5 year later is likely to be at least 2%. Improving logistics, lower reliance on COD, higher consumer confidence, removal of payment system frictions, better service quality, more polished players, better supply chain management, higher fulfillment rates, growing middle class, increasing prosperity and spending power are all factors that will play a part in increasing the base rate.
Some of us in the analytics world think that since we have already skipped a few steps in ecosystem evolution, our actual share may be even higher.
But let’s not be too greedy. Let’s stick with that 2%.
That 2% translates into a market size of US$ 7.6 – US$ 8 billion in 2022. At 4% you are looking at US$ 15 – US$ 16 billion. Our current “hand waving magical wand in the air” market size estimate is US$ 400 million.
What happens to a market when it jumps from US$ 400 million to US$ 16 billion in 5 years?
When a market jumps from US$ 400 million to US$ 16 billion do you really care if your original market estimate was US$ 400 million or US$ 650 million?
If you sold out at US$ 400 million and the market jumped to US$ 16 billion… Let’s not even go there. You would be what we would define as a sucker.
If you have the staying power for 5 years, I think it’s time to buy some online real estate. If you had the foresight to buy it and have credible business management skills, it’s not time to sell, it is time to hang on to it because you are in for the ride of your life.
In English, please.
So here is what all of the above means in simple English. In case you don’t like spending too much time with tables or on numbers.
The current numbers out there, made popular by the usual suspects range between 110$M TO 170$M. The state owned official nice to have figure is 1 billion by 2020[3] subject to usual qualifications.
The question to ask your self is, if you were pitching those numbers because you work at an ecommerce store/ allied business, would you really be dumb enough to get out now or do you just need an exit valuation so you don’t get past the hype cycle you created yourself? Bonus pool? Contract renewals? End of the line?
The time is now. Raise capital and stay afloat. Sit down and plan out the long game. There is no point to get out now, as you are in the driving seat or at least have a shot at it (you know who you are). If you are cash rich it is time to diversify. Buy some of the really crazy plays out there. 500 odd players is not large enough for a country of this size and the volume we are talking about.
Imagine getting into DHA Phase 8 in 1997-98. Everyone was selling, the city was on fire, valuations were crap, sentiments and basements were both underwater and people laughed at you if you even mentioned buying real estate in Karachi. And then to make matters worse dollar account were frozen and sanctions were in place.
If only you had listened we wouldn’t be having this conversation right now and you wouldn’t need to work today.
This promises to have the DHA/Bahria style returns the average saiths are looking for – Not 10X but 100X if you call it right and have staying power. If you know what you are doing and you have the right people on side to help you scale and sustain. This isn’t for every one. Most people will die due to inexperience, greed and timing challenges. Only a few will survive.
Here is another kicker for my many friends shopping for exits and posting pictures with our esteemed friends from China. What we must all realize, is that if a Daraz type transaction goes through, it does zero for the ecosystem.
Most if not all the money exchanges hands out side of Pakistan and no value is created till such time that a new operator/player is fully involved domestically. All they buy is a brand and a functional site, albeit well known and mostly with other sister properties regionally. A regional/geographic play for the buyer and if the price is right, a fantastic one in 5 years.
Yayvo and the lot, if a transaction does go through, the buyer actually buys a really big tongue twister. A race to the bottom with out VC money to burn. Race to the bottom (cutting price) type outfits are really not needed.
The data in its true form shows that you don’t need to underprice to deliver. Investors must ask what is the rocket science in selling product at steep discounts funded by their dollars? It is the oldest question for sales team – anyone can sell at a discount – why do we need you?
The market has the appetite for real players with real service. More so if you own data, fulfillment, delivery, service quality and warehousing. Beyond self-promotion on social platforms and hashtags the substance is lacking or lost in translation. If hashtags were GMV all these social media types would be billionaires.
All others who aren’t in a race to the bottom or a rush for quick exits in the end will do better. Write this down on a piece of paper and look at it when people mention exits. Just two words, two syllables. Long Term.
A small slice of a US$ 15 billion dollar pie goes a long way. Not everyone will make it to the table or have the appetite to sit or stay on it. Those who do will all have one thing in common. A healthy respect for other people’s money and the ability to play the long game.
* All the nice informative bits in this piece including the easy to read tables in color were crafted by our resident numbers guru Mr. Jawwad – ask the right question – Farid. I would recommend a google search, if you haven’t met the gentleman or crossed his path. He is even more polite than his prose in real life as long as you don’t mention funding or short term exits in his presence.
All the other nasty, waspy, brutal parts that will eventually piss of the ecom/bankers/transaction types were crafted by yours truly.
[1] State Bank of Pakistan, Annual Review, 2017. Page 25. This is the first year that this number was tracked and reported by the central bank. That by itself is a market action trigger.
[2] The Internet economy in the G-20, Boston Consulting Group, 2013-2014
Thanks for sharing this awesome blogs with us.